Stocks Outperform Oil
The beginning of the month always presents a timely opportunity to reflect on the previous 31-day period, summarise the main events and developments, and attempt to draw conclusions as to whether they in any way foreshadow what might lie ahead in the immediate future. This is particularly true when the US is on holiday and trading is as slow as it understandably was yesterday, with prices ticking up due to a defensive dollar as rate cut expectations rise and persistent attacks on Russian oil infrastructure.
As August approached, trading volume was comparatively low, and volatility subsequently declined. This, nonetheless, does not mean that last month was a typical gooseberry season, far from it. A handful of traders might have enjoyed the sun at the beach, but the world did not stand still.
The first thing that catches the eye is the diverging fortunes of oil and equities. It might be tempting to say that seeing the stock market produce a positive return against monthly losses in oil is an anomaly, but it now appears to be the new norm. At the beginning of the second Trump presidency, one unit of the S&P 500 index would have bought you 83 barrels of WTI (and 62 barrels a year before). By the end of August, it was 101 barrels.
So, why are investors in equities, both global and US, so buoyant? There are two possible explanations for this perennial optimism.
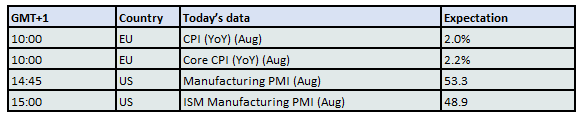
The first is that the coercive trade policies of the US administration have not yet been reflected in hard data. In other words, the impact of import tariffs is far from perceptible. The US labour market remains relatively stable, and inflationary pressure has not been reignited. According to the Bureau of Labor Statistics, the jobless rate stood at 4.2% in July, stuck in the 4.0%–4.2% range since May 2024. The Fed’s preferred measure of inflation, the Personal Consumption Expenditures (PCE) Price Index, does not suggest galloping consumer prices either. Annual inflation, as measured by the PCE Price Index, stood at 2.6% in July, matching expectations. The core reading came in at 2.9%, a slight uptick from the previous month, but not alarming.
Both the US job market and consumer prices appear to warrant the Fed joining its peers in lowering the cost of borrowing, something the US central bank has so far been reluctant to do, much to the chagrin of the President. The Fed chair’s speech at the recent Jackson Hole symposium hinted at a rate cut this month, which will be confirmed or delayed after Friday’s pivotal nonfarm payroll release. In any case, government pressure to monopolise monetary policy, or, to use the fashionable term, to assert “fiscal dominance”, is likely to continue. If successful, there is a real danger of a “Turkey syndrome,” where cutting borrowing costs prematurely leads to a painful rise in consumer prices.
The second reason for equity strength is the unconditional affection for the AI sector. As of mid-August, the seven largest tech firms were collectively responsible for 34% of the total market value of the 500 companies in the S&P 500 index. Let us digest this ratio: less than 1.5% of the companies account for more than one-third of total capitalisation. Is this sustainable, or does it echo the dotcom boom and bust? Once it is widely believed that these companies are overvalued, a sobering reality could set in.
While US data justifies the upbeat mood in equities, the impact of import tariffs is already being observed elsewhere. Recent data from the manufacturing sector show that Asian factories are feeling the heat from punitive US measures. Factory activity shrank in Japan, South Korea, and Taiwan as excise duties raised barriers for exporters, while in China, the sector weakened for the fifth consecutive month, according to official data. Despite the first expansion in EU manufacturing since 2002, and confidence remaining relatively high, it is reasonable to expect a serious rethink of the state of both the global and US economies before the curtain falls on the year, especially if backed up by deteriorating hard data.
Oil Is Not Immune to Import Taxes
Last month confirmed what had already become increasingly obvious. The deal-maker US President does not shy away from using tariffs as leverage or as a foreign policy tool. At the end of August, 50% US tariffs on Indian goods came into effect, punishing the world’s largest country for buying Russian oil. While it might seem perplexing that only India fell victim to secondary sanctions, and not China, and that punitive measures have not been imposed directly on Russia, the answer likely lies in Donald Trump’s view of the new world order, where the US, Russia, and China each control their own spheres of influence.
The US’s reluctance to poke the Russian bear, nonetheless, did not deter Ukraine from imposing its own sanctions on the invader. These came in the form of drone attacks, which seriously damaged Russia’s refining sector. This naturally led to reduced product output but higher crude oil exports. These strikes are not merely an increase in geopolitical risk premium; they represent actual product shortages.
Yet not only crude oil but also refined products yielded negative returns last month. More tellingly, there has been an unmistakable weakening of market structures. The M1/M7 WTI spread fell from $3.73/bbl to $1.68/bbl in August. The same spread in Brent retreated from $3.48/bbl to $2.03/bbl, while the premium on front-week Brent CFDs plunged from $1.50/bbl at the end of July to just 50 cents/bbl a month later.
This reversal can be explained by OPEC+ gradually adding back 2.2 mbpd to the market and by the perceived increase in Russian crude oil exports. The supply of crude oil, therefore, could remain abundant in the coming months, setting a ceiling on outright prices. If, however, continued refinery attacks keep hindering product availability, we could well face a situation where flat prices remain under pressure, but crack spreads stay elevated, a dynamic that was already conspicuous throughout August.
Overnight Pricing

02 Sep 2025
